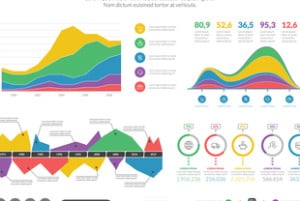
Big data visualizations are now easy, but not all visuals have value.
Business data used to be the exclusive domain of analytics professionals and the IT department. No longer. A growing number of tools, such as Tableau, SAP Lumira, and Qlik, now allow drag-and-drop data visualizations from enormously large data sets. The average business manager, in other words, can now make data discoveries that improve the company’s bottom line.
According to a TDWI survey, most businesses are looking to use visual data discovery tools for executive management and insight (70 percent), customer insight and engagement (68 percent) and predictive insights (58 percent). About half the organizations surveyed also cited “faster response to change” and a “complete view of customer activity across channels.”
One attraction of self-service visual data discovery is that the average business user doesn’t need to learn how to code to use the tool. Dan Meier, an expert on IT and manufacturing, for instance, told Tableau:
“If we have 100 engineers in manufacturing, maybe 20 of those engineers know how to write a SQL query, but maybe only three or four or five of those engineers have access to the database to be able to get the information that they need.”
But there’s a challenge: Just because a tool is easy to use and produces beautiful, accurate visualizations of millions of rows of data doesn’t mean that the analysis is sound.
“Many people think that perhaps no skills are needed to perform data discovery,” said Fern Halper of TDWI during a recent webinar on “Delivering business value faster with visual data discovery.”
Visual data skills
Anyone using a visual data discovery tool needs critical thinking, a “data sense,” and the ability to tell a story, Halper said.
Critical thinking is about the “ability to formulate a question and think in numbers of an attribute,” Halper said. “So even if you’re doing sort of this visual data discovery you still need to be able to think about how to formulate a question.”
For example, a business may be interested in seeing how they are losing customers. “It’s one thing to say I want to [look at] customer defection. That’s a general goal. It’s another thing to formulate the question to get at why customers are defecting. And what to do about it.”
As for data sense, that might include examining outliers, derived and calculated variables, or having the perspective to examine different kinds of data, such as demographic data or unstructured textual data.
But beware: “Just because it looks like there’s a correlation doesn’t mean that X caused Y,” advises Halper.
To acquire data sense, an average business user doesn’t need a data science degree, but “it can be a matter of taking some training classes, or some organizations do onsite training at least on the tools and techniques,” Halper said. “It’s about building the skills.”
A third skill is data storytelling. “A story should capture our imagination. It starts with the hook that grabs our attention and then it contains a story line that holds our interest and it ends with a resolution,” Halper said. Data stories should also go beyond a simple recounting of facts or numbers and weave together pieces of analysis.
Halper advises that the visualization isn’t the entire story, and not to overwhelm an audience with facts and figures. Good data stories, rather have narratives and are also concise.
Asking the right question
What factors might affect a university’s retention rate for low-income students: grade-point averages, choice of major, alcohol use?
When Valdosta State University asked that question, they went beyond examining traditional data such as academic performance. They considered data such as library usage and specific demographics.
Here’s what they found: Students that had breakfast on campus or had a job on campus were more likely to stay and graduate. The university has made a $200,000 investment in student jobs on campus, which will likely save $2 million in retention costs over the course of four years.
“Organizations that are leaders in use of visual analytics tend to consider more data than their peers and run more experiments,” explained José Villacís Sr. of Oracle during the webinar.
Data-driven organizations “recognize that analytics and discovery are two sides of the same coin,” he said. Data storytelling is now an iterative process, and winning organizations “literally obsess about learning and not the technology.”
However, the technology should support the storytelling.
In that respect, one challenge is that business intelligence tools — while definitely an advance over spreadsheets — may not be easy for non-technical staff to use. “So a lot of users aren’t getting the data they need and they just go back to their spreadsheets,” said Dave Stodder, research director of business intelligence for TDWI.


