Observability adoption is growing fast–and the tech stacks running observability are becoming bloated. Watch our experts talk about why and what to do about it.
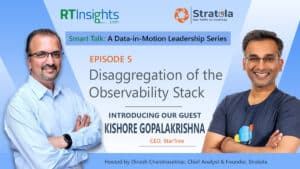
Every company measuring the health and performance of their IT/Cloud/Application infrastructure leverages various data-in-motion streams such as metrics, events, logs, and traces. But, as the complexity of such infrastructures grows, so does the number of monitoring tools in each company. This also results in a bloated observability stack. Join Dinesh Chandrasekhar, Chief Analyst and Founder, Stratola, as he dissects this concept, its origins, its evolution, and its future with our special guest for this episode of Smart Talk – Kishore Gopalakrishna, CEO, StarTree.
Kishore delves passionately into his notion of a disaggregated stack for observability and how a database like StarTree (powered by Apache Pinot) helps with user-facing analytics easily. This episode, while slightly longer than our typical episode, is packed with a ton of information on the convergence of data-in-motion, observability, and AI.
Topics they discuss include:
- Birth of Apache Pinot at LinkedIn
- Evolution of observability
- Layers in the observability stack
- Standardization and contracts and Legos
- Integrated system, federation, single pane of glass
- System-first thinking
- Cisco WebEx observability use case
Guest
Kishore Gopalakrishna, CEO, StarTree
Kishore Gopalakrishna is the co-founder and CEO of StarTree, a venture-backed startup focused on Apache Pinot – the open-source real-time distributed OLAP engine that he and StarTree’s founding team developed at LinkedIn and Uber. Kishore is passionate about solving hard problems in distributed systems and has authored various projects in the space such as Apache Helix, a cluster management framework for building distributed systems; Espresso, a distributed document store; and ThirdEye, a platform for anomaly detection and root cause analysis at LinkedIn.
Host: Dinesh Chandrasekhar is a technology evangelist, a thought leader, and a seasoned IT industry analyst. With close to 30 years of experience, Dinesh has worked on B2B enterprise software as well as SaaS products delivering and marketing sophisticated solutions for customers with complex architectures. He has also defined and executed highly successful GTM strategies to launch several high-growth products into the market at various companies like LogicMonitor, Cloudera, Hortonworks, CA Technologies, Software AG, IBM etc. He is a prolific speaker, blogger, and a weekend coder. Dinesh holds an MBA degree from Santa Clara University and a Master’s degree in Computer Applications from the University of Madras. Currently, Dinesh runs his own company, Stratola, a customer-focused business strategy consulting and full-stack marketing services firm.
Resources
Watch Smart Talk Episode 1: The Data-in-Motion Ecosystem Landscape
Watch Smart Talk Episode 2: The Rise of GenAI Applications with Data-in-Motion
Watch Smart Talk Episode 3: Modern Data Pipelines and LLMs
Watch Smart Talk Episode 4: Real-Time Data and Vector Databases
View the data-in-motion ecosystem map here
Learn more about data-in-motion on RTInsights here
Dinesh Chandrasekhar
Hello and welcome to this episode of Smart Talk, a data-in-motion leadership series. Today we have a very exciting guest, Kishore Gopalakrishna. He is the CEO of StarrTree. Kishore is no stranger to the technologist-becoming-a-founder story. He is practically one. He started in technology working at companies like Yahoo and LinkedIn and then eventually founding his own company, StarTree. So, welcome.
Kishore Gopalakrishna
Thank you Dinesh. Super excited to be on this show.
Dinesh Chandrasekhar
Wonderful, thank you. So tell us a little bit about StarTree for users that do not know who StarTree is, it’d be fantastic given that StarTree has been fairly young in the industry but has been making some great waves as well.
Kishore Gopalakrishna (01:09):
Yeah, absolutely. So for those of you who are not familiar with StarTree, this is a cloud-based real-time analytics platform. And this is built on Apache Pinot, which is the open source project that we started back at LinkedIn in the 2014, 2015 timeframe. One of the key things that differentiates us from other analytical providers is we focus explicitly on speed at scale and also we cater to the companies that want to provide analytics to their customers and partners. So we kind of refer to that as user-facing analytics or external-facing analytics. So there are key requirements there in terms of latency, concurrency, and even freshness of the data. Those things make it really, really challenging for companies to address the needs of user-facing analytics. We specialize in that and that’s one of the key differentiators for strategy
Dinesh Chandrasekhar (02:06):
The data freshness topic is really close to my heart. But I’m also very excited about this open-source foundation that you have it on. So Apache Pinot is what it’s based on. I would like to know a little bit more about Apache Pinot. Why Apache Pinot? Why did you found it way back in the 2014-15 timeframe? What was the need that made you wanting to build Apache Pinot?
Kishore Gopalakrishna (02:34):
Yeah, absolutely. I mean one, I already built another database before Apache Pinot. This was Espresso, which is MongoDB, Cassandra, and other systems. It’s the one that stores pretty much all the LinkedIn data. And for me after that I knew how hard it was to build a database and I really didn’t want to build one. So it was really a bunch of things that happened together which forced me to build another database. I think the first thing was really about LinkedIn, thinking about how can we bring analytics to the masses, right? When I say masses beyond LinkedIn, like all the hundreds of millions of members of LinkedIn, how can we serve analytics to them? Nowthat was a pretty cool idea from a business point of view because they wanted to improve the engagement on the LinkedIn website and that forced us to build. The first version we didn’t actually build–Pinot first version was launched on something similar to Lucene and the search system that we had already built at LinkedIn and the product was very successful, but behind the scenes it was very expensive for us.
We needed almost, I mean I tell the story multiple times, it’s a thousand nodes to actually run who would make a profile, which pretty much every person on LinkedIn uses it now. So that was huge and I think that is when we saw the power of building something like this, building data products, providing insights to our users, but at the same time we found that the backend was not something that we could maintain or operate and last but not the least is super expensive. And that forced us to rethink and say, “Hey, there is no one who has attacked the scale that is needed for external facing analytics.” So on one hand it has the workload of an O TP system, which has these millions of queries coming in per second. On the other hand, it has the functionality of an analytical system, which is all app and which is slicing and dicing and aggregation.
So there’s getting the best of two words into one system. That was a challenging thing and no other system solved it. And we knew the power of what it would enable us to do at LinkedIn when we have a system like that. And that’s what got us to build Apache Pinot. That changed the game today. If you look at any number on LinkedIn or Uber or Stripe, they’re all actually coming from some Apache backend. So people don’t believe this, but they’re almost serving 200,000 queries per second just on LinkedIn. So it’s a massive success for us in terms of just going from ideation to actually building a system for scale and seeing the adoption in a lot of different companies.
Dinesh Chandrasekhar (05:11):
Fantastic. And how big is the Apache Pinot community today?
Kishore Gopalakrishna (05:15):
I think overall across looking at the Slack community and the Meetup community, we are close to 10,000 members across both.
Dinesh Chandrasekhar (05:24):
Very cool, very cool.
Kishore Gopalakrishna (05:24):
Yeah, it’s amazing to see the growth. I remember when we started, we had a hundred members in the Slack community and then seeing that growth go from a hundred members to really, really massive adoption of Pinot and also the growth in the community, it’s fantastic to witness that.
Dinesh Chandrasekhar (05:42):
I mean that’s one thing that I’ve seen from the open-source communities as well where if the project is good, it’s convincing. If it’s exciting, the crowds will come. They definitely want to be part of that moment. So that’s fantastic. So switching gears into the topic of the day, we decided we’ll be talking about observability for whatever reason, but I believe now I can clearly see why we picked that particular topic because you spoke about user-facing analytics and real-time analytics, which is the heart of what you do, and data-in-motion is the heart of this talk series. That’s what I’ve been working on with so many different data leaders. So it makes perfect sense for us to connect on that today. I’ve said this many times before, data-in-motion is all different types of streams, log streams, click streams, social streams, event streams where all types of different streams coming from IOT devices and whatnot. And so when you talk about log streams and event streams from across the IT infrastructure, it is kind of almost inevitable that observability is that elephant in the room that we need to address. We need to talk about that. So I think it’ll be a great topic if we can talk about the relationship between real-time data and observability.
First off, let me open it up by asking a very generic question. What is your take on observability from your vantage point? How are you looking at observability?
Kishore Gopalakrishna (07:02)
I mean, I have been in the data space for a long time and it’s amazing to see actually the definition of observability change over time. I think that is something that is interesting to see because earlier it used to be just things like Splunk and what they do on the logs. I think that was then observability and then we also got into metrics and then companies like AppDynamics, new Relic all made them, made metrics as the first class. And then slowly now we are getting into tracers as well. And now it’s even people just monitoring the clickstream and then looking at the funnel analytics, user analytics and user behavior, they also consider that as observability. And last but not the least, even monitoring the business metrics of hey, I have this revenue, I have this derived metrics on top of that. So I think the definition of observability itself is very broad to me.
I think it is metrics, logs and traces monitoring of those. But the new thing that is getting added into that is the events. So some people call them MELT formetrics, events, logs and traces. Some of them just refer to metrics, logs and traces as, but in essence, to me, in short, everything is an event. Whether you have a log in that or a metric in that or a case in that, it’s just a specialization of that. To me, if I take a step back and look at it, it’s pretty much having insights over events and if you can get insights over all the events that you’re capturing, that’s basically observability to some extent.
Dinesh Chandrasekhar (08:36):
I completely agree and you are right when it comes to the definition having changed over time. I’ve worked in the observability space for quite a bit as well, and I’ve personally seen companies that were urgently infrastructure monitoring alone or network monitoring alone, suddenly start adding on additional capabilities and then calling themselves more of an observatory platform and all that as well. One thing I do see value in that is the connectivity across all these different monitoring needs. If you monitor infrastructure, you also want to understand what went wrong as a result of that particular cluster failing or so forth, which means now you’re trying to understand failures or root cause analysis on the network failures as well. And then potentially connecting that with other infrastructure components and also maybe even the application needs, application failures as well. If you consider that there are quite a lot of vendors, it’s a crowded space by the way. There are quite a lot of vendors there talking about full stack observability, unified observability and the whole nature of everything being together and all that. But I know that you have a slightly different perspective on it. You call it desegregation or so forth. So why don’t I give you the mic and let you explain your perspective on this particular stack today and what is your take on it?
Kishore Gopalakrishna (10:01):
I think that’s a great segue into what we wanted to talk about and this is really how the observability stack is evolving over a period of time. If we go back a few decades, and there is always the concept of all-in-one, I mean even if you look at starting from Oracle, which was pretty much the only database a company needed at some point you would get your events in it, you would get your sales orders in it, you can pretty much do everything as part of that. And then slowly as the scale increased, we could see that one system is not good enough to do all the different things that happen within a database or even within that particular stack. And that’s the same thing that we are seeing in observability. This has already happened in the analytic stack, so this is not new phenomena that we are seeing, it’s just that it’s now transferring into the observability stack as well.
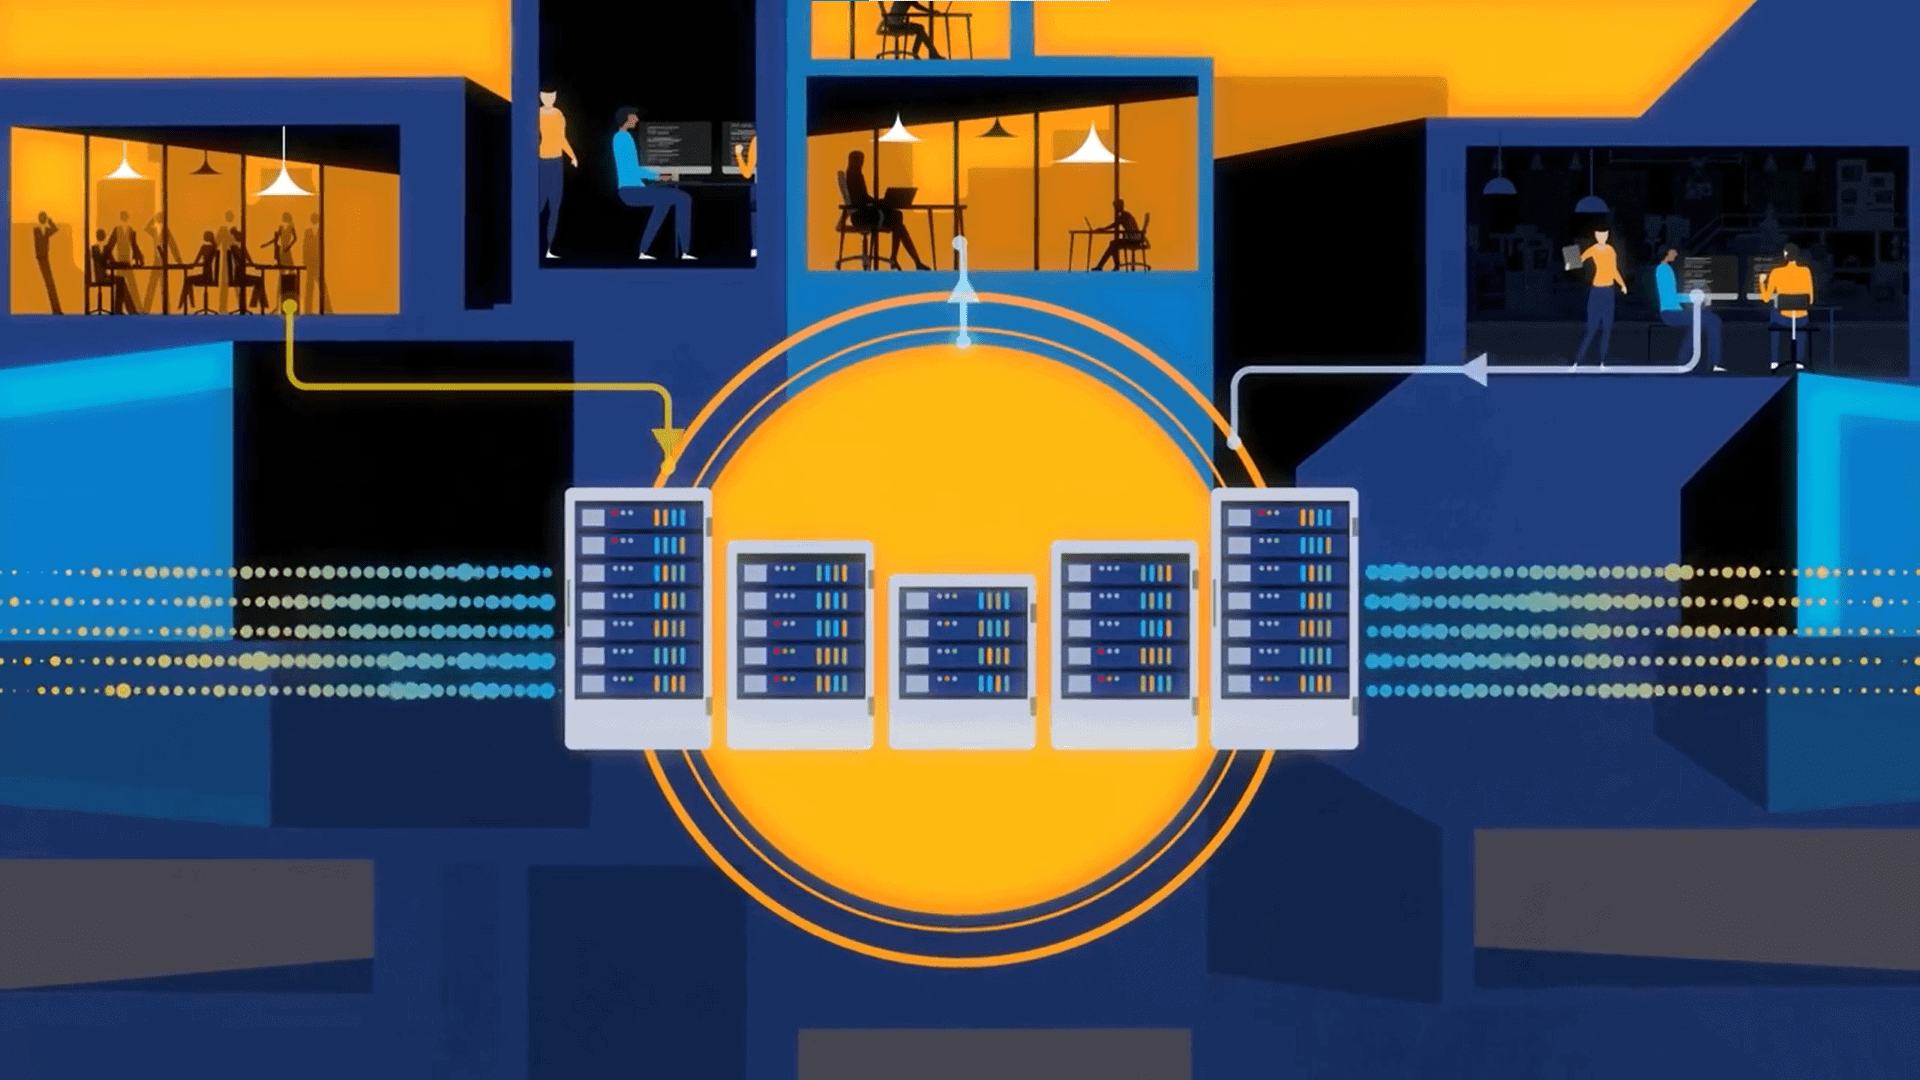
If you look at Databricks for example, the query engine and the data are actually separate, the collection is separate. You have Kafka, Red Panda and things like that. And then even the emission and agents, right? All these things are getting broken into different layers. Now if you look at the observability stack as well, what is happening there is if you look at let’s say Datadog or AppDynamics or New Relic and if you deep dive into the technology stack that they have internally, they have collection in layer first, which is basically emitting all the different events from your Kubernetes or from your services. And that used to be a huge thing because it was very hard to actually get this data and that is where it was a big mod that AppDynamics, and New Relic had. But that has become standardized now.
So now most of them use either Prometheus or Open Telemetry format and the formats are getting standardized, the agents are getting standardized and it’s almost become a commodity. So now you can get to the next layer, which is what was the collection layer, and people had to build their own before Kafka and messaging systems existed, people had their own way of collecting this and they would use some sort of a collection service. Now that layer is also getting standardized and if you take P cut, like all the technology stacks at these companies, they probably use something like either Kafka or Red Panda or Nessie and things and systems like that. So you have some kind of agents now you standardized on the collection and then there is also the processing layer that is also getting standardized. You had Flink SAMSA and there are a lot of other systems out there that are actually doing stream processing which kind of transforms the data or adds some additional things, which is not necessarily needed in the observability stack, but it is an optional thing that some people do have in that additional stack as well.
But then they put the output of that back into the stream stream source, which is like Kafka. So now that is another layer that is and then goes into the storage and query layer. And then most companies ended up building their own storage layer and the query layer as well. But they kept it very specific for solving the metric use case, the logs use case and the traces use case that is coming in. But if you look at each use case, there are different indexing techniques that you actually apply for text. It’s a different indexing for metrics. And then you have the visualization layer to kind of sum it up. What is happening right now is that this is getting standardized, this stack is getting standardized, doesn’t matter who the vendor is, whatever they’re doing end to end, they always separate out these things within their stack.
And that is where we see opportunities–instead of having single vendor doing an all-in-one solution, the horizontal standardization is happening and there are multiple benefits. And this is not happening just because you can do it, but I think there are other advantages. One is people are realizing that the data that they use for metrics, they can actually do more things on that data, not just about monitoring and looking at visualizing it in Grafana. They can actually build models on that, they can do anomaly detection on that, they can do alerting on that. So there are a lot of other data scientists who can actually use those metrics and you can run spam jobs, reports and things like that.
Dinesh Chandrasekhar (14:40):
Then you can send It to SIM systems where you can do a whole lot
Kishore Gopalakrishna (14:42):
Exactly right. You can even get into security and things like that. So I think the number of applications that you can build on the same data data is increasing a lot. You can actually use the data for other applications. So what that means now is, if you go with a single vendor you don’t have access to the data because they’re only giving you one kind of visualization. And that opens up how people are realizing the benefit of this data is not necessarily for one application. They can actually run multiple applications on top of it. And the fact that now if they come up with new applications, they can actually just build on the existing stack.
So I think I give this analogy in other places as well is we kind of, if you look at when you go and try to buy a toy for your kid, you have two options. You can just buy a toy that is ready made and it’s a robot. It basically does X, Y, Z or you can buy a Lego set. And the thing is with the Lego set, you can now build so many different toys and there is a very well established contract between every Lego piece. You can join them together to build so many things. Obviously it’s a do-it-yourself model versus a toy that as soon as you get it home you can actually do something with that toy. So I think the whole data ecosystem is basically getting transformed into a list of composable systems and it’s something that is happening in analytics area and now we see that happening onthe observability side as well.
Dinesh Chandrasekhar (16:17):
Very cool. But on that note though, if I were to ask you purely from experience in my conversations with CIOs and CTOs and companies that have been trying to dabble with observability platforms, one of the common things that I hear is, hey, I have five different departments, one for cloud infrastructure, one for applications, and one for DevOps and whatnot. And everybody has their own set of monitoring tools. So a dozen tools here, a dozen tools there. I lack the single pane of glass inability to look inside all of this and understand what’s going on across my enterprise. Why is a particular failure happening like a website down or something like that. So troubleshooting becomes a major challenge when I have a plethora of tools. The second thing that I also have is the cost. Obviously if you have 30 40 tools across the enterprise for monitoring, the cost is humongous.
So to your point about this Lego model based nf putting things together, yes it’s DIY, but I feel like you are saying it gives you more flexibility, gives you more ability to put it together yourself and all that. Do you still feel that this model will still yield a lesser cost model for the CIO or the CTO will also be able to eliminate these dozens of tools and be able to standardize on something more sophisticated that gives the CIO, the CTO the flexibility to say I have a single pane of glass.
Kishore Gopalakrishna (17:48):
In fact, this is the reason why they have so many different tools. Again, the tools will continue to exist. I think what the tool does will actually change. They’ll focus on what they’re supposed to do and do it really, really well. Because what is happening today is if you look at that single plane of glass, there is no way you can actually have that unless you capture the entire data of the company Right now we spread itin so many different systems, it’s impossible for you to capture that. And I think the segregation will actually help in someone coming up with a single plane of glass that can actually interact with all these different systems. And the disaggregation, the best part is that it actually enforces the contract between the two layers. So end up having a PS look at S3 for example.
There was no a standard API for looking at blob storage, but S3 became popular and that established as the defacto even though there are other APIs, but S3 is the one that ended up becoming the standard one. So whoever is the most prominent in that space ends up becoming a defacto API. Now we have the Prometheus or other format in terms of how you actually send theses metrics. So that’s another standardization. And once the API gets standardized, now you can have different systems and it actually makes it very easy for the CIO to actually replace the underlying system as long there’s adherence to this standard format. And to me, having that allows someone to come in and build a fantastic tool on top of these platforms that can actually look at, hey, now can you have this data in this system. Is it talking SQL?
Yes, I can then talk to that. Is it talking PromQl? Is it talking LogQL? Is it talking TraceQL? I can actually pull all these things together and I can provide a fantastic tool which is almost impossible to do today. And that’s the reason why a CIO has so many tools–because each tool can just work on the data that it has. They’re not focusing on the interop probability or the federation concept. That’s going to change. I can actually build a pretty cool tool and a very efficient and a very promising tool by leveraging data across multiple systems and accept the fact that the tool doesn’t own the data, but it’s actually accessing data across different sources and that’s the right way to solve this. I’ve also built a system like Third Eye, which is an anomaly detection and root cause analysis system. And I’ve sat through how the SRE, the operators actually debug and do the triaging. You’re absolutely right. They go through so many different tools. And the reason is not because it’s tool problem, it’s just because the data is spread in so many different ways and each tool is coming with its own data. But if you kind of separate the data from the tools functionality, the tool can potentially do more things than what it’s doing today.
Dinesh Chandrasekhar (21:01):
So in a way you are saying right now with this proliferation of tools across the enterprise, there are data silos that inadvertently happen and you are liberating them by saying pull all the data together. Now you have one single pane of glass at the data level at least where now you can use all kinds of querying and API mechanisms to access that and use any kind of visualization from the flexibility and interoperability perspective. So in a way you’re democratizing.
Kishore Gopalakrishna (21:32):
Yes, yes and no. I think you’re trying to minimize, I think to me at the end of the day, if I look at it from a company point of view, you want to minimize the number of tools. It doesn’t mean that you’ll just have one tool in every layer. I think one system in every layer. So you want to minimize. So we are saying yes, we’ll come up with one system for metrics, logs and traces in terms of storage and query capability because they’re all converging in terms of the requirements of what needs to happen there. But there are other systems as well. If you try to do a root cause analysis for example, you probably want to look into what are the campaigns that are launched, what holidays are there? Those things don’t have to be in the system. They can be coming from APIs, they can be coming from your Jira system. So you might want the tool that is built on top to have these contracts with other systems as well that they can actually pull the events from. So there will be more than just the metrics, locks, and traces. Absolutely. I think that’s a given. It’s never going to be one system. I think every company tries that. They will come up with one system that solves everything else and then they just end up having n plus one system.
Dinesh Chandrasekhar (22:44):
Cool. A fantastic perspective. Thank you so much for sharing that from a guidance perspective. Real quick, if you can offer any kind of guidance for data teams that are working on their data architectures to modify, to accommodate models like what you’re suggesting, what would they have to do?
Kishore Gopalakrishna (23:03):
I think I always suggest this from the systems perspective, just first understand the systems, all the systems that they have and ask why that system will exist. I think most people just go to the next tool thing and then think that that will solve all the problems, but they don’t really think about why was this system put in place and what problem it’s solving? And second, how is it solving? Most people ignore that. I think without, I saw someone actually moving from Elasticsearch to Snowflake and then they realized that, okay, Snowflake doesn’t have text index changes like that because that’s another system that’s a lot more popular than the other system. But try to understand from first principles, why was the existing system there? Why did the existing system, what was it solving? What hard problems was it actually solving as well? And then figure out, I think as you rightly mentioned, you can go all the way to the extreme and say like, okay, can we bring in one system that solves all of them?
But it’s generally very hard. So I think once you understand the problem, you’ll be in a better position to minimize the number of systems that you need. And always think about four or five years from now in terms of what new applications that you will be building and the system that you’re actually bringing in. Can it scale to the new needs? And also how solid the design is of that system that kit can actually adapt as new things happen within the ecosystem. I think those are some of the attributes that I would keep in mind when you’re picking up a new system or even trying to rearchitect.
Dinesh Chandrasekhar (24:47):
Any quick case studies that you can think of where you’ve seen this kind of success with this kind of a aggregated stack that you’re talking about?
Kishore Gopalakrishna (24:59):
Yeah, absolutely. I think I would like to bring in the Cisco use case that I think they also presented in one of the real-time analytics summits we had, and there is also a very nice blog. So they took this Elasticsearch and Kibana […] and log stash and stacked that. They actually had repurposed with Apache Pinot as the storage engine and then they built a Grafana plugin on top of it, which mimics the Kibana interface on top of it. So they were able to put together the stack end to end for the entire WebEx monitoring. So we are having this call on Zoom, so think about having monitoring on all the calls that are happening. I think that’s something that they did with WebEx and they had this exact disaggregated stack that we mentioned with Kafka in between, with agents sending out the data and then consuming it, and then Grafana on the other end for the visualization.
Dinesh Chandrasekhar (26:00):
Fantastic. So last thing, this has been a great conversation. I would like to close out with your outlook on the next two to three years about this particular space. You have a very unique vantage point obviously as a CEO of a company that is hot and happening with user-facing analytics. And then now you’re talking about this emerging into spaces like observability. Would love to understand how you’re seeing the next two to three years emerge.
Kishore Gopalakrishna (26:27):
I think the one thing that I’m excited, obviously apart from there is going to be massive improvement in the cost efficiency and the speed of wearing this data. I think that’s something that’s going to happen. The blobs are becoming much more powerful. So you’ll see that. But I think what I’m excited about is what kind of applications will get built given now that you can actually get this kind of speed. I think that’s always the way evolutions happen in my view. I mean you kind of go from walking to cycling to car to airplane to rockets. I think it’s all in the end they’re all solving the speed problem, but once you get that speed, you can actually solve a lot of other applications. I think that’s where I feel the AI stuff is also going to be a massive change in terms of this data because this data is actually super powerful.
And I would say the amount of data that we are capturing today is massive, but probably most companies are extracting one to 2% of the value. Most of them, they’re just leaving it on the table. I mean that’s the whole pitch about real time analytics for us is the data value becomes zero so quickly and if you don’t act on it, you’re most likely going to lose it. And you have a very short window to actually capitalize on that. And the observability is really the essence of data-in-motion and real time. I think that’s, those two things have to come together and AI is going to change the game there as well.
Dinesh Chandrasekhar (28:03):
There you go. We have to have AI in the conversation for, yeah, absolutely everything. Kishore, thank you so much for a wonderful conversation. This has been really, really good. I think the forward-facing perspectives that you have about AI and observability and data and motion coming together show that the possibilities are endless. So thank you so much. Appreciate it and have a wonderful day.
Kishore Gopalakrishna (28:30):
Thank you. Thank you for having me on the show. It was a pleasure.


