By combining knowledge graphs and machine learning, organizations can extend the capabilities of ML and ensure the results derived from their models have solid explainability and trustworthiness.
The current applications of Machine Learning (ML) are widespread: from deciding which trades to execute on Wall Street, determining credit decisions, optimizing inventory, improving product recommendations, predicting whether a user will click an ad, or Google’s ability to improve cooling efficiency at data centers. And that just scratches the surface. The heart of what makes ML possible is vast amounts of data, meaning if businesses don’t have access to or a good understanding of data relationships of their data assets, they will miss opportunities. Knowledge graphs can help.
Download Now: Building Real-time Location Applications on Massive DatasetsWhy? Companies striving to define and implement machine learning at the same time are discovering the easy part is implementing the algorithms used to make machines intelligent about a data set or problem. So what’s the hard part? Here’s a clue: data is emerging as the key differentiator in the machine learning race. Companies are scrambling to transform themselves to stay competitive digitally, and the stakes couldn’t be higher.
As a result, organizations are looking to knowledge graph technologies to enhance data search, information retrieval, and recommendations. By combining knowledge graphs with machine learning, organizations can make machine learning more ubiquitous and successful. According to Gartner research, 23% of organizations deployed graph techniques in their artificial intelligence (AI) projects. Perhaps other organizations don’t know they can combine knowledge graphs with machine learning by using platforms that are easy to adopt and scale. This makes machine learning more commonplace and more successful.
See also: How Datagraphs Provide a Competitive Advantage
Knowledge Graphs and Its Relationship to Machine Learning
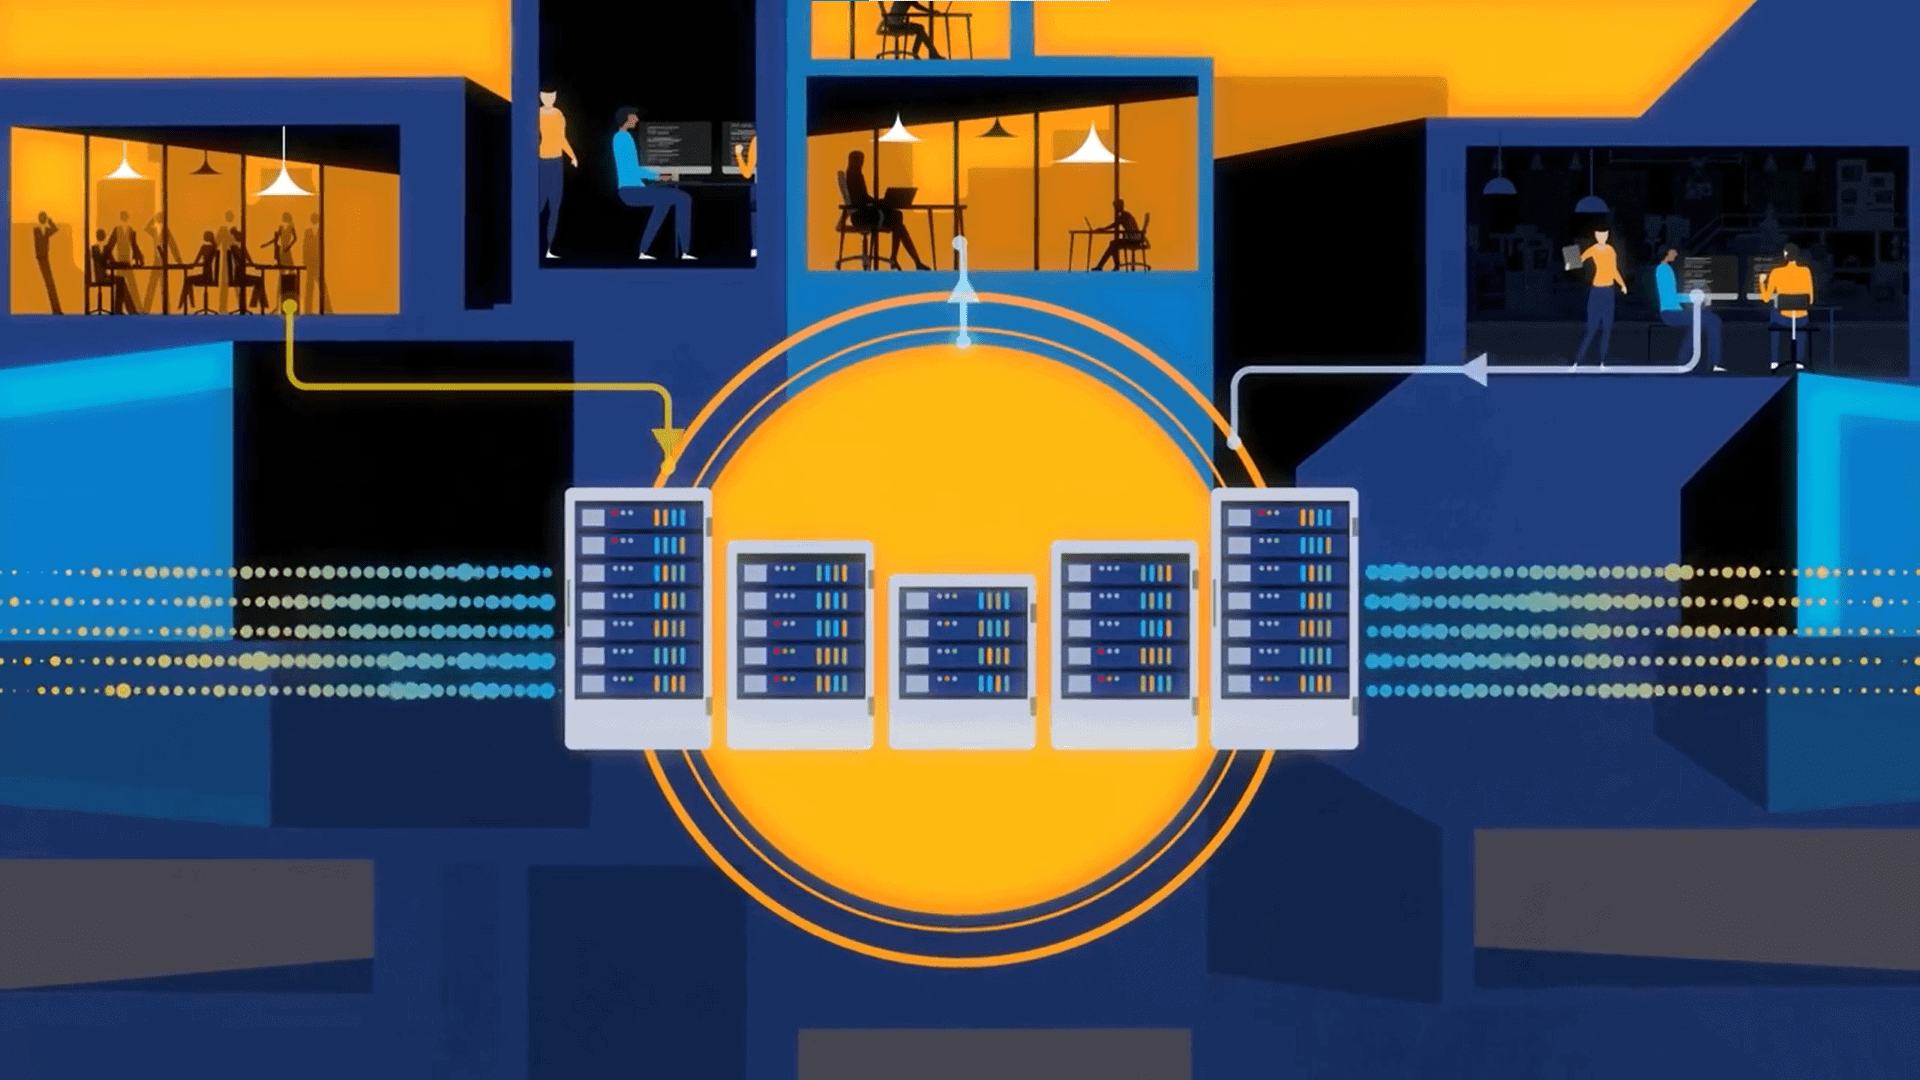
Knowledge graphs connect and contextualize disparate data. Built to capture dynamics, knowledge graphs easily accept new data, datasets, definitions, and requirements. As each part of the organization elevates its information as facts in the knowledge graph, more insight is gained and more value realized. The knowledge graph is often positioned as the semantic data layer in the data layer of the enterprise. The “semantic” part is the ability to describe the meaning of entities and relationships, whether that be in simple taxonomies to in-depth ontologies that capture the meaning of the data. As a layer in an enterprise architecture, the knowledge provides a secure suite of endpoints for consuming the knowledge graph across an ecosystem of commercial off-the-shelf software, analyst tools, data science tool chains, and much more.
Machine learning and Artificial Intelligence (AI) burst onto the scene over the past decade, fueled by stories from self-driving cars to the largest internet providers having eerily accurate recommendation engines on what we may like to purchase next. The ML process story begins and ends with data, and the challenge is clear: companies that can acquire clean and connected data to train the ML models and then use these additional facts will dominate the next decade of technology solutions across nearly every sector.
How does a knowledge graph address this challenge? The answer comes back to the data. Starting at the beginning, the data scientist and ML solutions require high-quality information, correctly interpreted such that it may be used in feature engineering, trained in models, and analyzed in the results. Many teams do this today by hand, calling it data wrangling and spending upwards of 70-80% of the developer’s time reworking and re-shaping the data. The knowledge graph provides the connected, aligned with harmonized terminology across all domains of the business and set up for easy consumption in all sorts of ML tools and software systems. The result is far fewer hours spent looking for data, cleaning data, or having to re-shape it for the ML process. Additionally, the metadata about those features and what happened with that data can all be captured in the knowledge graph. This provides pedigree to the likely facts, predictions, or classifications produced by running the ML models.
The second major area is what happens to the results of the ML runs? Traditionally these values may be used to provide a specific report, feed a particular dashboard, or provide a feedback cycle to additional ML routines. The knowledge graph provides another option: capture these likely facts, the predictions and recommendations, weights and scores, and other generated information and augment the graph. The ML outputs aren’t just tagged or labeled but harmonized with the business model they relate to, and specifically linked to the key entities and relationships referenced in the model’s output.
This ML-to-knowledge graph process can be done in the form of enriching existing knowledge with new information learned by the ML process or by combining several ML outputs into a graph for analysis and further development. For example, take an ML model that predicts next month’s manufacturing output and another ML model that predicts supply chain bottlenecks at major ports. These two outputs can be combined in the enterprise knowledge graph that would typically contain Customer 360, Product 360, and other cross-cutting graphs along with logical models and constraints. Such a system would enable the enterprise to make more agile and informed decisions beyond if they just had the ML reports or just had the knowledge graph.
Given that knowledge graphs provide domain information and context in a machine-readable format, organizations can integrate them with explainable ML approaches, providing more trustworthy explanations. By combining knowledge graphs and machine learning, organizations can extend the capabilities of machine learning and ensure the result derived from machine learning models have solid explainability and trustworthiness.
Download Now: Building Real-time Location Applications on Massive Datasets

