How real-time data can be used to personalize events, enhance attendee experience, and produce measurable business outcomes.
Would you buy a car without knowing for sure it would work?
Of course not! Yet that is what businesses do every day when it comes to meetings and events.
Global events are a $565 billion per year industry1. Companies spend 25 – 30 percent of the entire marketing budget on events and conferences2. Yet most of them do not know how to assess the return on this investment.
In the past decade, other marketing channels have become increasingly digitized. Companies can measure every dollar and see what they are getting for their spend. But meetings and events have faced serious obstacles to digital transformation. Challenges include the inherent complexities of executing and assessing the impact of live events, where most interaction takes place in the physical world – not the digital constructs of websites, landing pages or emails. As a result, the industry has lacked a clear line of sight on the value events generate.
Fortunately, a wave of innovation has given early adopters the means to dramatically change the game for the better. iBeacons, smart badges, wearable technology, event mobile apps and real-time dashboards are bridging the gap between the online and offline worlds. These innovations not only improve the user experience and facilitate attendee engagement; they also gather valuable data to shine a light on event performance.
Meeting and event organizers now have the unprecedented ability to see how their events are performing in real-time: what’s working, what’s not, what topics and areas of the show floor are attracting the most attention, who the most influential participants are, what’s the level of attendee engagement and satisfaction, which partners are having a good show and which are being overlooked. . . etc. These types of insights contribute to a more complete view of an event’s impact and enable organizers to make adjustments on the fly to improve outcomes.
While live events are the biggest line item on many corporate marketing budgets, they also are widely regarded as one of the most effective marketing activities. But in the past, it has just been near-impossible to prove that gut instinct. Given the massive spend, however, the pressure is on to make a clear, data-driven case for the return on investment. In a competitive environment full of choices, businesses need to provide a similar – if not greater – level of transparency into the value their meetings and events generate. Event-related data provides the means to do just that.
Data and analytics enrich live events
Harnessed properly, data and real-time analytics are proven game changers, driving a paradigm shift to a new era of event-performance marketing. Here are three ways this remarkable shift is enabling businesses to measure and optimize the value of their events.
Speed and agility: Most event reporting has not changed much in the past 25+ years, with initial data typically becoming available 12 – 48 hours after the event concludes. By the time the data arrives and gets sorted, team focus often has shifted elsewhere, usually to the next event. Thankfully, things are changing fast. The emerging standard is essentially, “what’s happening now.” Driving this shift are low-cost, real-time data collection options, near real-time analytics, and evolving market needs. The result is increased event data as well as investment in advanced analytical tools and supporting processes, working together to put that data to use.
Smart sensors, both fixed and portable, now capture synchronous data streams, acting as digital eyes and ears at a scale and level of precision we could not otherwise achieve. This technology enables organizers to track activity in session rooms and exhibit halls at a fraction of the cost and effort of prior-generation technology, such as Radio-Frequency Identification (RFID). The lower cost is driving adoption, creating a virtuous cycle.
Data capture is only part of the story. Monitoring all that data and putting it to use is a massive undertaking. This critical task often falls to specialized algorithms that constantly monitor data streams, looking for patterns that signal a need for action. An extended period of low foot traffic around a platinum sponsor’s location, for instance, could trigger a timely alert to the organizer. It could automatically send a message to a targeted group of attendees, too, with a special offer enticing them to visit the sponsor’s booth.
Personalization: Having real-time access to the data around events enables companies to provide a more personalized experience. Applications range from suggesting conference sessions and special events to alerting attendees that their session is about to start, and even brokering invitations among attendees with common interests to enhance networking.
Although most organizers gather profile information on their attendees through their event registration process, many fail to connect the dots. Those dots are the metadata that describe conference sessions, exhibitors, keynote speakers and special events. Taxonomies, in turn, help ensure consistency and linkages across various and sometimes seemingly unrelated items. An attendee who listed him/herself as a Data Security Manager, for example, may be interested in a session highlighting advanced encryption technologies. New event performance technologies connect the dots to deliver a more customized attendee experience.
Measurable business outcomes: With technology providing a giant window to event activity, companies can further maximize value with quantitative ROI reports for exhibitors and sponsors. You can measure success from many perspectives based on KPIs relevant to the type of event (e.g., sales leads, networking, continuing education credits). Broader views of performance are also possible, by looking into marketing automation and CRM (customer relationship management) platforms to assess the event’s impact on sales conversions. Other relevant analysis compares year-over-year activity, looking at changes in attendance, ticket sales, time spent in key areas like the exhibit hall, attendee satisfaction and more.
 Staying ahead of the curve
To develop the new event performance tools, providers overcame significant hurdles in the areas of data generation, capture, and analysis.
Data generation: It wasn’t so long ago that organizers hired someone to walk around the event with a clipboard to record onsite activity and collect feedback. Thankfully, we have moved well past those manual, largely subjective mechanisms. Today, we have a broad range of devices designed to increase and monitor attendee engagement, while generating data at scale. Examples include scanning smart badges for access to VIP areas, participating in scavenger hunts, text messaging fellow event participants, and rating everything from sessions and speakers to food and entertainment.
Real-time data capture: The primary tool facilitating these interactions has been event mobile apps, with wearables gaining significant adoption over the past 12 – 18 months. This represents a massive shift and opportunity because the prior generation of data capture mechanisms, such as RFID, had operational and cost drawbacks. Today, portable beacons and smart hubs are changing the data capture game in terms of both affordability and flexibility.
Another stalwart, cabled Ethernet, is reliable but not always practical, given the typical need for long cable runs within dynamic venue settings. Fortunately, compression algorithms running natively on smart hubs reduce data transmission needs. They have helped make wireless a very attractive option, especially when paired with intelligent sensors that use mesh network technology. These self-healing networks enable the data to hop from one smart device to another, as the data makes its way from device to network to database. The result is significant improvements in reliability, resiliency and coverage.
Data analysis: The key here is knowing where to look in the data pool. As with most data-intensive applications, much of the data captured at events is neither actionable nor helpful. To determine what type of data to collect and analyze, it is imperative to understand the event’s business objectives. In other words, follow Stephen Covey’s advice, “begin with the end in mind.”
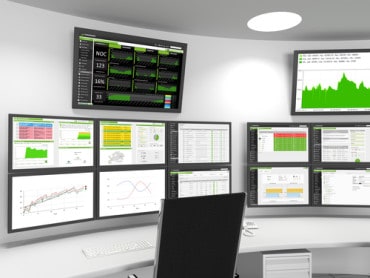
To that end, progressive players in the industry are using suites of practical, actionable metrics, such as attendance, conversion (sign-up and show-up onsite), session and speaker ratings, and overall satisfaction. More advanced analytics assess participant engagement and identify key influencers, providing event stakeholders with powerful insights about an event’s audience and impact. Dashboard visualizations provide additional context by displaying time-series data as charts and foot traffic as heat maps.
Event performance management with real-time data
Making real-time data useful involves conveying its meaning to the right person at the right time in a way that helps, not distracts. Threshold alerts do just that by combining event goal data with real-time actuals. In this way, the event platform can inform and even advise participants to enhance their experience. Think notifications like: “Your next session begins in five minutes in Ballroom A” and “Onsite registration times at Registration Kiosk #2 are running 50% above average.”
New analytics platforms put data into context throughout the event lifecycle. Some also provide benchmarking against comparable historical events, enabling year-over-year comparisons, or measuring performance against similar events. Armed with the context that benchmarks provide, event managers can make informed decisions and identify precisely where to focus resources to improve business outcomes.
Advances in event technology continue to surge, and event marketers have expressed a clear need for tools that enable data-driven decision-making3. In our metric-focused business world, it is only a matter of time before these strategies become widely adopted.
1. Frost & Sullivan. 2. Forrester Research. 3. etouches, Bizbash


