Detecting fraud is no easy feat; it can have a big impact on the customer experience. Even more difficult, fraud can also be detected in real-time to push through the orders from your good customers and preserve the positive experience you’re always aiming for on your site. But, as RTInsights expert contributor Dr. Pedro Bizarro illustrates here, it’s so much easier said than done.
Like rocket science, fraud detection needs the right elements to come together at the right time. But without one element or by being a second off, a rocket will miss its landing target and be lost in space -just like those transactions. To complete your mission of detecting fraud for your business, you need to go at it with the right frame of mind by knowing the following three components. First, know that fraud on a grand scale is miniscule but its repercussions are massive. Second, catch it while it happens. And third, accurately understand which orders are, in fact, fraudulent as opposed to orders from your loyal customers.
Few and far between: One of the reasons credit and debit card fraud detection is hard is because it is so rare
With all of the recent data breaches, this may sound like a false statement but consider this: According to astronomers at the Mount Lemmon Observatory in Arizona, there is an asteroid (they’re calling it “2011 AG5”) whose current orbit gives it a 1-in-625 chance of hitting Earth. As for credit or debit card fraud, depending upon channel or geography, it is expected that between 1 in 1,000 to 1 in 50,000 transactions are fraudulent.
In fact, fraud is so rare that, normally, we don’t even use percentage to discuss it. Rather, we use basis points (bps): one percent equals 100 bps. For example, in 2013, fraud in credit and debit cards in the UK was at 5.9 bps, which is considered fairly active fraud levels. But, even though the UK is one of the countries with the most fraud prevalence in Europe, 5.9 bps points represent just 0.059 percent (or about $1 out of every $1,700) in fraud. In fact, payment fraud occurs less than two times than the rate of breast cancer in men.
However, measuring things by using basis points can abstract the underlying economic impact. The 5.9 bps of fraud in the UK equals $900M in fraud per year, which is more money than Netflix has earned in the last three years. The problem then becomes how to protect and detect the $900M in fraud without blocking or annoying the other 99.941 percent of payments from loyal customers.
Machine learning models help to detect fraud and they are even more helpful when they work in real-time
For example, my company has analyzed years of payment history comprising more than $600 billion. Profiles for every single card, terminal and merchant were created, and we train advanced machine learning models by using those profiles. Finally, we use those models to score transactions on a 0 to 1,000 scale. Zero represents very low risk and 1,000 represents the highest risk.
If machine learning models were perfect, they would score all non-fraud transactions with zero and all fraud transactions with 1,000. Of course, no model is perfect. But they can get pretty close to perfect results.
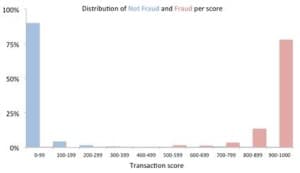
The graph below depicts the distribution of scores for a financial institution:
These results seem pretty good: The very large majority of non-fraud transactions are on the left (96 percent of non-fraud money is below the 500 “risk-splitter” threshold) and the large majority of fraud transactions are to the right (98 percent of fraud money is above the 500 threshold).
These distributions mean that, if we select the 500 threshold as the value above which we mark transactions as fraud, we would detect 98 percent of fraud. But we would also incorrectly tag four percent of the non-fraud money as fraud.
Always consider the false positive rate
Detecting 98 percent of fraud with four percent of False-Positive Rate (FPR) – the rate of good transactions that you would block which simultaneously annoys customers and blocks sales – might make some people excited. But we know better: size matters.
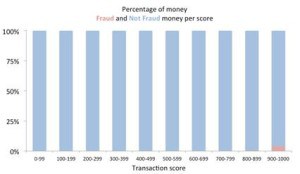
In this case, there was about 3.3 bps of fraud, which means there is one fraud transaction for every 3,000 non-fraud transactions. It also means that, to make the blue bars and red bars of the previous graph in the same scale, we need to multiple the size of the blue bars by 3,000. This is what we get now:

This also means that, in $10M dollars of transactions, $3,300 are fraud and about $9.9M fraud are not fraud. Of the $3,300, the model above detects 98 percent of them or $$3,234. However, with a four percent FPR, it also means that, out of the $9.9M dollars that are not fraud, a staggering $400K would be incorrectly be marked as fraud. It does not look so good anymore: A false-positive rate of four percent is simply too high of a percentage as it would block transactions from or raise alarms on too many loyal customers.
To fix the problem of a high fraud positive rate, we developed an improved model that detects 95 percent of all fraud, with just a 0.6 percent false-positive rate. This new model reduces the number of false positives six-fold.
In order to safeguard the customer experience and preserve your bottom line, do not blindly optimize for detection rates without considering the FPR, and make sure you are analyzing the data in real-time. Remember, the fraud rate might look small but there are real customers behind the numbers. Detecting criminals without losing sight of loyal customers is a balancing act.


