Rocana, a provider of root cause analysis software, started with a historical focus on IT monitoring — showing where and when problems were occurring with IT equipment — but now has added some predictive capabilities.
Its flagship product, Rocana Ops, is an anomaly detection tool that uses machine learning to analyze hundreds of thousands events in real time with IT infrastructure–whether event volume or use of CPU and RAM resources. Applications include blacklisted IPs, monitoring of applications, and reducing web page latency on e-commerce websites, which is crucial during traffic and sales spikes.
The system has a clickable interface that Rocana touts as easy-to-use for an average business worker, but also allows root-cause analysis for more sophisticated users. The system, however, goes beyond standard root cause analysis software. Within Rocana Ops is a WARN module, which stands for Weighted Algorithm for Risk Notification. WARN looks at several metrics for a particular host over time to predict where and why problems might emerge.
In the video below, RTInsights executive analyst Adrian Bowles interviews Omer Trajman, CEO of Rocana, who discusses the company’s approach to IT monitoring:
Related: Rocana rolls out 1 TB of free data
Transcript:
Omer: My name is Omer Trajman, I’m the CEO and one of the co-founders of Rocana.
Adrian: Terrific and Rocana is actually sort of an acronym.
Omer: It is sort of. It stands for Root Cause Analysis. We make global IT monitoring software. Understanding how data centers operate everything from a small to a global scale.
Adrian: When was the company founded?
Omer: We were founded, beginning of 2014. We’ve raised some money from folks like GV, formerly Google Ventures, General Catalysts, Toba Capital, Brian Stevens, Paul Saegen. We have one software product called Rocana Ops. This is a suite of capabilities that allow you to collect data from really anything and everything in your data center, regardless of source. I think of it as anything with a blinking light. It applies intelligent algoritims to that. It makes the data searchable and applies analytics to it and has a very easy-to-use, purpose-built visual console that’s designed to help everyone from the level 1 operator be 10 times more productive, to your high-end operators, because the operator need to understand what the root cause of the problem was.
Built for ease of use
Omer: One of the key features of the product, [one of the] principles behind why we built it is — everything’s clickable. There’s no such thing as a “display only,” or you’re never just going to hover on something, get some info, and never be able to dive in deeper.
You can always click in, click in and jump into a particular area that’s going to give you a little bit more information or something a little bit richer or a different view of what you’re looking for. Everything has got kind of pre-built, it looks at the data, pre-builds your facets. I don’t have to tell it what hosts I am monitoring, they self report. I don’t have to tell it what services I’m looking at, they self report. I can say, “I want this view of the data, I want today and I want this exact time last Monday and the Monday before. I want this one to show me errors, this one to show me errors in the morning, this one just to how me everything and then here’s the facets that I want to see from these things.”
An early warning system
We launched a new module called, WARN, which is Weighted Algorithm for Risk Notification. Rather than bombarding people with constant alerts, they already have that. What we do is look at every single individual time series in the system. These are hundred’s of thousands of time series. Going back to, I think we’ve talked about like the broker analogy, where you’re L1 is like your trader on the floor, right. They need to have the Bloomberg terminal. What we do is look at all of the metrics that are coming in. Each one of them gets analyzed individually. We build a pattern going back months.
We weight that to try and figure out how much a particular sort of time series of data is deviated from the expected pattern and most systems will kind of stop there. They tell you, you know, 1,000 of your 100,000 systems are misbehaving, okay well that’s one percent. Do I care? Do I not care? Is there any relationship? It’s still a lot for someone to figure out. What we do is we do a second order aggregate. We’ll look at for example, all of the metrics in a particular host, say every host has ten metrics, your CPU, your network, your memory, your disk and some promoted metrics.
For example, it’s a web server, I want to know the HTP response size code. I want to know the event volume overall, in terms of activity. We’ll look at all of those metrics and then score the severity. How differentiated they are from what [was] expected. Are they slightly off? Are they far off? Then aggregate that and produce a WARN score for each and every host. Every physical location, every logical location, like a virtual or physical host. Every service has metrics associated with it and we’re telling you in aggregate, how those metrics are behaving relative to their history as a whole. Relative to their history individually. Relative to their peers.
Adrian: How far back does the history go?
Omer: We keep history for as long as you want. We currently score the data going back, I think 8 weeks.
Adrian: When you’re looking at historical data, you’re really using sort of a descriptive analytics. It seems like where you’re going with this is taking it to the next step and doing predictive analytics.
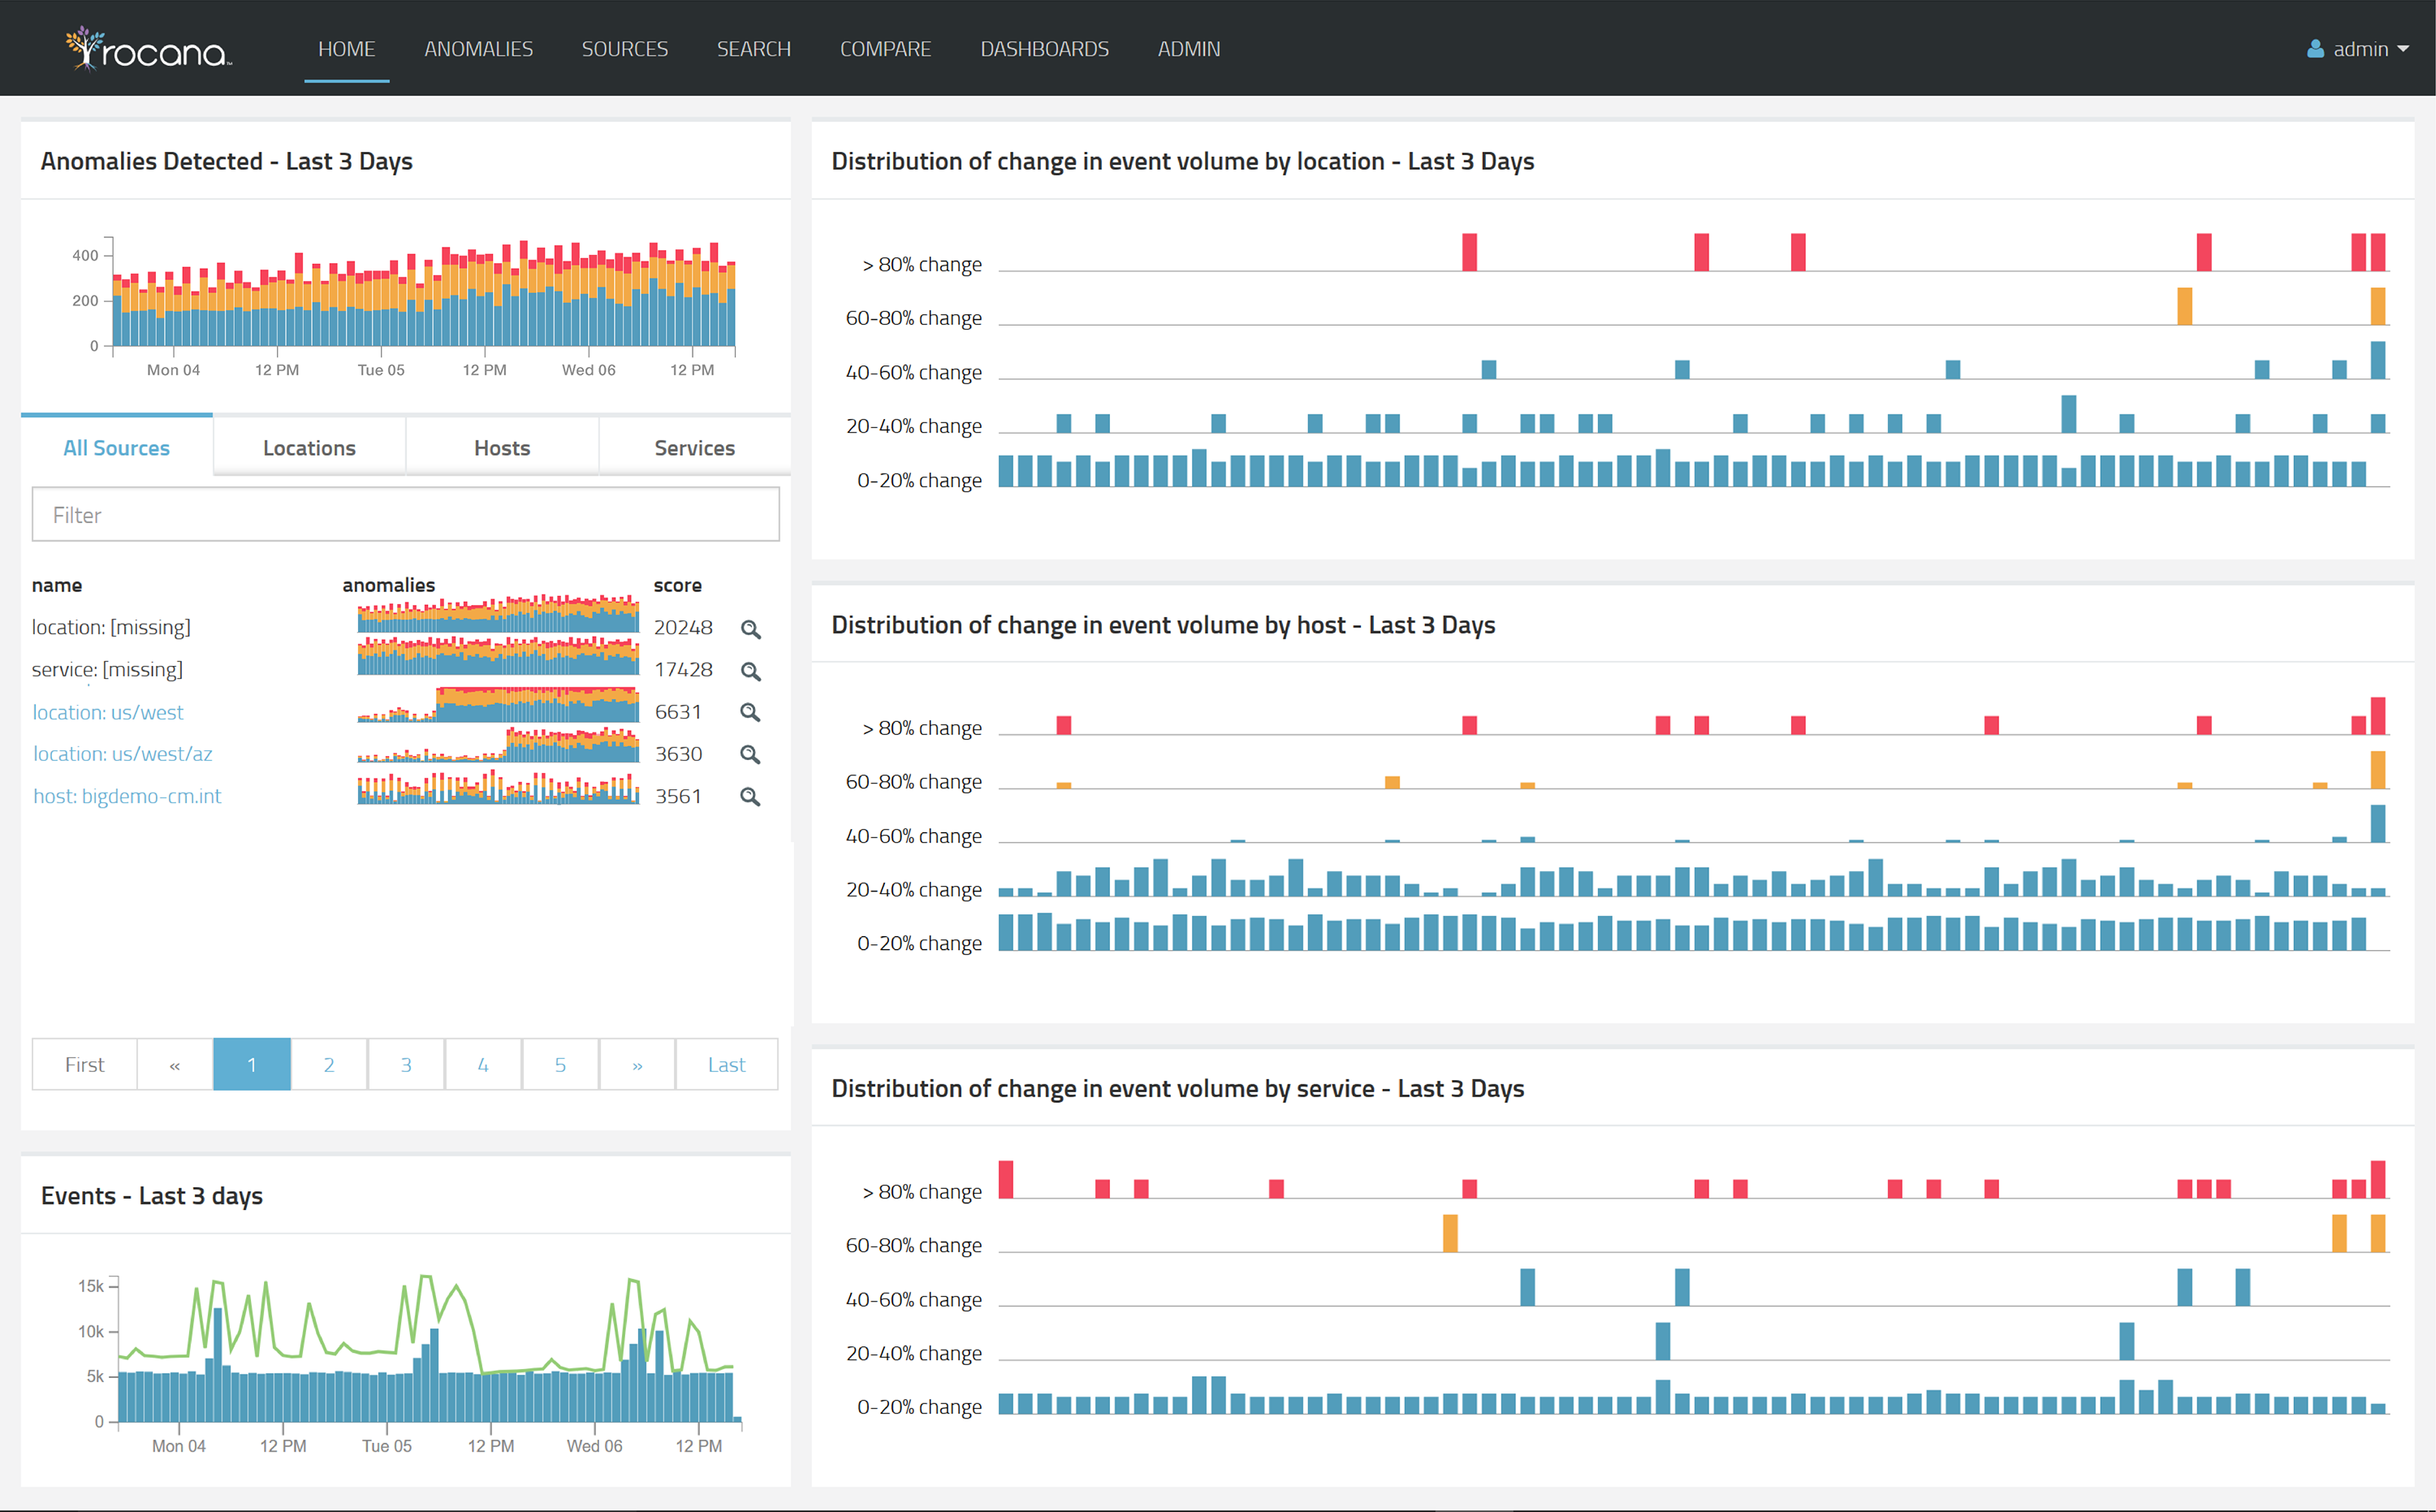
A Rocana dashboard.
Omer: It’s always difficult when you’re talking about an operational scenario. You can tell people, “This is what happened and I can show the data to demonstrate that.” The guided root cause analysis is actually a lot easier to do in a sense that people understand how to relate to it. Ultimately if I am showing you something, you don’t know how to use that data, it doesn’t matter what I’m showing you. If I am telling you “this is going to happen, trust me” — building that trust takes time. We started with largely historical focus, guided root cause analysis. Our recent introduction of the WARN module, that capability starts to show you where problems seem to be emerging but we tell you why.
Prediction first — root cause analysis second
We show you historically, this is why we think this server a suspect. This is why we think this service has problems. This is what we expected it to do and this is what it’s actually doing. You shift it back into kind of a guided root cause analysis mode so you can quickly say, “oh yeah, these guys are actually showing me things that are going to be likely problems. I need to solve it now or I need to solve it later.” We’re looking at how do you kind of pre-define — I know that end of month I have a problem. I know that end of quarter right, there’s going to be… There what usually happens is everything kind of moves in sync. While you might get a slight increase in severity, everything will, rather than just one thing.
You kind of know to expect it. That context..what is one system doing based on the metric information, relative to its peers, relative to its history? That’s what allows me to say, “Well that machine over there or that service over there, I’ve got to look into it before I have a problem, and then I can do my guided root cause analysis without, you know the building burning down. It’s actually much calmer affair.”
Want more? Check out our most-read content:
White Paper: How to ‘Future-Proof’ a Streaming Analytics Platform
Research from Gartner: Real-Time Analytics with the Internet of Things
E-Book: How to Move to a Fast Data Architecture
The Value of Bringing Analytics to the Edge
What’s Your Business Intelligence System? How About Your Culture
Liked this article? Share it with your colleagues!